The 5 signals that reveal growth, cash flow, and execution drift before monthly reports do.
Weekly founder metrics expose risk earlier than monthly dashboards do by surfacing weak signals in pipeline quality, cash-flow timing, customer behaviour, operational friction, and decision latency.
The real advantage is not more reporting—it is faster access to the truth while problems are still reversible.
Founders who review these signals weekly make better decisions because they shorten the distance between reality and response.
Most founders do not have a data problem. They have a timing problem.
The default leadership rhythm says wait for the monthly dashboard, review the board pack, then decide. It feels disciplined. In practice, it creates delayed certainty. By the time margin compression, pipeline weakness, or delivery drag appears in a report, the business has already been living inside the problem for weeks.
That delay is where risk compounds.
Sales behaviour changes before conversion rates fall. Customers disengage before churn shows up. Rework rises before margin visibly slips.
The numbers are accurate, but accuracy without timing is expensive—especially in a $5M–$20M business where decisions around hiring, spend, and growth bets compound quickly.
The deeper failure is not KPI selection. It is signal freshness.
A perfect metric delivered too late is strategically weaker than an imperfect signal delivered in time to change course. Founders are usually taught to monitor outcomes. The better lens is to monitor how quickly reality is changing beneath the outcomes.
That shift changes the role of leadership itself. You are no longer reading reports to understand the past. You are designing a weekly system that catches drift while it is still cheap to reverse.
The founders who scale cleanly are rarely better at reading dashboards. They are better at seeing change sooner.
Why Weekly Founder Metrics Matter More Than Monthly Dashboards
Monthly dashboards explain. Weekly founder metrics control.
That is the real distinction.
A monthly dashboard is built for reporting accuracy. A founder metric should be built around a decision threshold. It should answer one question: where is the business drifting away from the assumptions we are still using to run it?
This is where most dashboards fail. They are designed around departmental reporting needs instead of leadership intervention points. Finance wants clean closes. Sales wants activity visibility. Operations wants output counts. None of those, on their own, help a founder see unstable feedback loops early enough to intervene.
Every visible business problem begins as weak system behaviour:
pipeline velocity slows before forecasts miss
customer silence rises before churn
handoffs multiply before margin compresses
stale data accumulates before bad decisions feel obvious
The founder identity shift here matters. At this stage, leadership is less about reacting to visible fires and more about detecting unstable loops before they ignite.
The longer this stays monthly, the more expensive your decisions become because each choice is being made against an older version of reality.
Delayed visibility increases correction cost. Early signals preserve optionality.
Pro tip
Only keep metrics that directly protect a decision you may need to make within seven days.
Late on a Thursday, a founder stared at a clean monthly dashboard that still showed a healthy margin and a strong pipeline.
By the following Tuesday, two “safe” deals had stalled, a key client delayed payment, and the operations lead flagged rework across three active projects. The numbers had been accurate, just late.
He stopped trusting polished hindsight and started building a weekly rhythm around weak signals instead.
Signal 1: Revenue Quality and Pipeline Integrity
Topline growth can hide a weakening sales engine.
Most founders still over-index on raw pipeline size. The sharper weekly signal is pipeline integrity—whether the opportunities in the CRM still deserve the confidence leadership is placing on them.
Review:
stage aging
proposal-to-close movement
no-decision rates
discount frequency
source quality
late-stage stalls
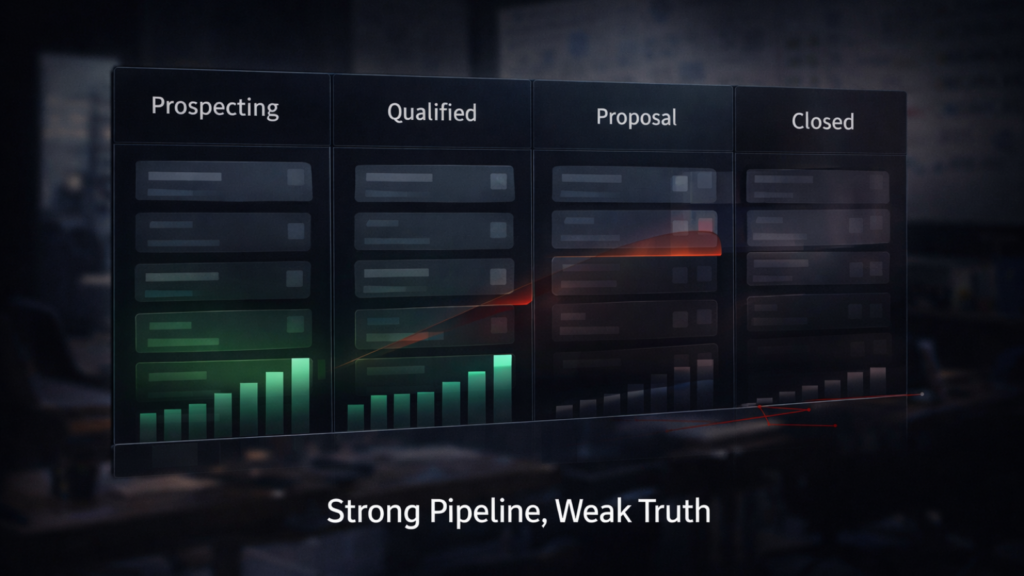
A pipeline that grows while movement slows is often not strength. It is demand distortion.
This is why your pipeline can look strong but fail to convert consistently.
The overlooked risk is stage assumption decay. Teams often keep deals in familiar stages even when buyer behaviour changes, so the labels stay stable while the truth underneath drifts. Forecast confidence remains high long after sales momentum weakens.
The stronger founder lens is not optimism. It is conversion honesty.
If stage aging rises and deal movement slows week over week, hiring and spend assumptions should be questioned immediately. Weak pipeline integrity contaminates cash expectations, team capacity planning, and growth confidence within the same quarter.
Weak pipeline integrity creates false confidence that spreads into every downstream decision.
Pro tip
Track the percentage of deals whose probability declines week over week.
Momentum loss is often the earliest monetizable truth in your revenue system.

Signal 2: Cash Flow Drift and Margin Compression
Profitability does not guarantee liquidity.
The sharper weekly signal is cash velocity—how quickly booked revenue becomes usable operating cash.
Founders often wait for monthly P&L visibility, but cash risk begins earlier in:
slower collections
rising project overruns
pricing exceptions
supplier cost creep
acquisition spend pulling cash forward faster than collections return it
This is where margin compression often hides.
The overlooked issue is that margin erosion is rarely just a cost problem. It is usually a decision latency problem. Pricing lags market conditions. Scope creep continues because no weekly signal forces reprioritisation. Teams keep servicing low-quality work because delivery friction has not yet become visible in finance.
The result is false confidence around hiring, tax planning, and discretionary spend.
What matters is not static margin percentage. It is whether the economic assumptions behind margin are still true this week.
Cash drift reduces optionality faster than most founders realise.
Pro tip
Run a weekly margin movement review by price, mix, discounting, and delivery hours.
Protect the decisions that create margin, not just the percentage itself.
Signal 3: Customer Behaviour Signals Before Churn
Churn is the final visible stage of earlier disengagement.
The weekly signal to watch is behavioural drift.
Look for:
slower replies
shorter meetings
reduced usage depth
fewer strategic questions
delayed approvals
more transactional language
Silence is often misread as stability. In reality, it is frequently the earliest sign that trust is weakening.
That is the uncommon but critical angle: customer silence is often a false positive.
By the time churn appears in reporting, the emotional exit has already happened. The revenue has not caught up yet.
Founders at this stage need to become better at recognising relationship patterns. The shift is from account oversight to trust signal detection.
The longer the disengagement stays invisible, the more likely forecasts quietly assume revenue that is already emotionally gone.
Churn prevention is cheapest when the signal is behavioural, not contractual.
Pro tip
Compare each key account against its own engagement baseline, not portfolio averages.
Risk lives in deviation from normal behaviour.
A service business owner noticed that her largest accounts had gone unusually quiet—fewer approvals, shorter calls, almost no strategic questions.
Instead of waiting for renewal risk to appear in finance, she reviewed engagement drift weekly and had her team re-enter accounts early with executive check-ins. Renewals stabilised, upsell conversations reopened, and forecasting became noticeably calmer.
She stopped reading churn as an event and started recognising it as a pattern.
Signal 4: Operational Throughput and Delivery Friction
Growth usually breaks in handoff before it breaks in sales.
The signal to watch weekly is delivery friction—the rising cost of moving work through the system.
Most businesses measure output. Fewer measure how much coordination, approval, rework, and managerial rescue was required to produce that output.
That hidden cost matters.
As businesses scale, many mistake more meetings and more coordination for maturity. In reality, this is often throughput decay: the system requires more human energy to achieve the same visible result.
The stronger founder metric is touches per outcome.
How many approvals are required before a proposal goes out?
How many revisions happen before a client signs off?
How often does delivery pause while teams wait for leadership decisions or cross-functional clarification?
As touches rise, margin and speed usually deteriorate before finance fully captures it.
This is often the earliest leading indicator of burnout, missed deadlines, reputation drag, and the subtle slowdown that forces sales teams to reset client expectations.
Why this matters now: delivery friction quietly taxes both growth capacity and margin quality.
Pro tip
Reduce touches per outcome before increasing headcount. Scale comes from fewer interventions, not more people managing the same inefficiency.

Signal 5: Decision Latency and Signal Freshness
This is the signal beneath every other signal.
The highest-leverage founder metric may be decision latency—the time between an operational shift and leadership awareness.
A stale number can still be accurate, but it is strategically weaker because reality has already moved.
This is where most dashboards quietly fail: they optimise for precision while ignoring signal half-life. Some metrics remain useful for weeks. Others lose decision value in 48 hours.
When leadership acts on expired conditions, the business starts executing yesterday’s truth at tomorrow’s cost.
This is why decision quality is always a function of relevance plus age.
Elite founders are not just better at choosing. They are better at choosing in time.
Every strategic advantage eventually compresses into faster recognition of reality.
Pro tip
Assign a freshness threshold to each critical metric—24 hours, 3 days, or 7 days—so leadership knows when data is no longer safe to use.
How to Turn Weekly Founder Metrics Into a Decision Rhythm
Metrics only matter when they trigger action.
The weekly review should be short, repeatable, and decisional:
What changed?
What assumption is now weaker?
What decision becomes necessary this week?
No long decks. No backward-looking commentary. Only drift, reversibility risk, and next moves.
For practical execution, anchor the rhythm to a 30-minute founder review with one owner, one threshold, and one next move per metric.
This prevents the common failure mode where dashboards create discussion but no leadership behaviour changes.
For every signal, define the leadership action it protects.
Examples:
pipeline integrity weakens → challenge hiring assumptions
cash velocity slows → tighten payment workflows
engagement drift rises → trigger executive outreach
touches per outcome increase → redesign handoffs
freshness degrades → collapse reporting pathways
This turns visibility into control and prevents the team from treating metrics as interesting but optional.
The strongest founders do not build better reports. They build better decision rhythms.
The businesses that look “suddenly unstable” are rarely surprised by reality—they are surprised by how long they normalised delayed truth.
Nothing dramatic happens at first. A few stale reports, a few assumptions carried forward, a few meetings spent explaining last month.
Then one day, the team realises they have been executing an expired version of the business.
Conclusion
The real risk was never missing data. It was relying on delayed truth.
Monthly dashboards make the business feel controlled while drift builds underneath—in pipeline quality, cash timing, customer trust, delivery load, and the speed at which reality reaches leadership.
The better lens is simple: weekly founder metrics are not reporting tools. They are decision-control systems.
That shift changes founder identity. You move from explaining outcomes to intercepting drift. From reacting to visible loss to protecting reversibility while problems are still small.
Your current state is optional.
You can keep managing polished hindsight and the false confidence that comes with delayed certainty, or you can build a weekly rhythm that shortens the distance between truth and action. One path creates a reactive culture that explains losses after they compound. The other creates a decisive culture that protects calm, margin, and strategic optionality while risk is still reversible.
The founders who win are rarely the busiest. They are the ones who see sooner.
Action Steps
1) Replace one monthly KPI with a weekly leading signal
Choose one metric currently reviewed only at month-end and convert it into a weekly early-warning signal.
For example, instead of waiting for monthly revenue totals, track pipeline stage aging, deal velocity, or proposal-to-close movement every Friday.
The goal is to spot drift while it is still reversible, not after it becomes a reporting issue.
Why this works: leading signals reveal movement before financial outcomes lock in.
2) Audit metric freshness across your leadership dashboard
Map the time gap between what changes in the business and when leadership sees it.
Ask:
How many days after buyer hesitation do we see pipeline weakness?
How long after delivery friction begins does margin reflect it?
When does customer silence become visible?
Any signal older than the decision it informs is already degrading in value.
Deeper lens: freshness is a strategic asset because timing shapes decision quality.
3) Create explicit decision thresholds for every weekly metric
A metric without a decision rule becomes passive reporting.
For each signal, define:
what “healthy” looks like
what drift looks like
what leadership action follows
Example:
If proposal stage aging rises by 20% week-over-week → review pipeline integrity
If receivables stretch beyond target days → tighten collection workflows
If customer engagement drops below baseline → trigger executive outreach
This converts visibility into a repeatable decision rhythm.
4) Track pipeline integrity, not just pipeline size
Do not let raw pipeline totals create false confidence.
Each week, review:
stage aging
velocity decay
discounting trends
source quality
no-decision rates
stalled late-stage deals
A growing pipeline with slowing movement often signals forecast distortion, not demand strength.
Strategic truth: momentum quality matters more than volume optics.
5) Measure touches per operational outcome
Pick one critical customer-facing workflow and count how many people, approvals, handoffs, or rework loops are required to complete it.
Examples:
number of approvals to ship a proposal
number of revisions before client sign-off
number of team interventions to deliver a project milestone
As touches rise, margin usually compresses before finance fully sees it.
This reveals where the business is substituting communication for system design.
6) Review customer engagement delta on top accounts weekly
For your top 10–20 revenue accounts, compare this week’s engagement against their own normal baseline, not generic portfolio averages.
Look for:
slower replies
fewer strategic questions
reduced usage depth
shorter calls
more transactional language
delayed approvals
Silence is often the earliest visible sign of trust drift.
This helps surface churn risk while the relationship is still recoverable.
7) Run a 30-minute weekly founder signal review
Protect a recurring weekly meeting focused only on:
drift
freshness
reversibility risk
next decision
No long reporting decks.
No backward-looking commentary.
Only: what changed, what it means, and what decision now becomes necessary.
The meeting should end with 1–3 direct leadership moves, not discussion notes.
The deeper lens: founder metrics only create value when they reduce the distance between truth and action.
FAQs
What are weekly founder metrics?
Weekly founder metrics are leading business signals reviewed every week to detect drift in revenue, cash flow, customer behaviour, delivery, and decision speed before monthly reports reveal the problem.
Why are weekly metrics better than monthly dashboards?
They improve decision timing. Monthly dashboards explain what already happened, while weekly signals reveal what is changing right now.
What is the most important founder metric to track weekly?
The most important metric is the one tied to your next irreversible decision, such as hiring, spend, pricing, or customer retention.
How many weekly founder metrics should I track?
Five is often enough: pipeline integrity, cash velocity, customer behaviour drift, delivery friction, and decision latency.
What is signal freshness in business metrics?
Signal freshness measures how current the data is when leadership receives it. Fresh signals improve strategic decision quality.
How do weekly metrics reduce risk?
They surface weak signals before they become visible financial or operational problems, reducing the cost of correction.
What causes dashboards to fail founders?
Most dashboards fail because they prioritise reporting accuracy over decision speed, making insights arrive too late to change outcomes.
Other Articles
Why Your Content Gets Traffic But Still Lacks Authority