Are you overwhelmed by endless data but still struggling to track your business’s true performance?
Many business owners feel lost when it comes to turning raw data into meaningful insights that drive real growth.
That’s where a well-built KPI dashboard comes in—a tool that organises and visualises your key metrics in one place, helping you stay on top of your goals and make informed decisions.
However, building the right KPI dashboard can seem daunting. There’s a lot to get right, from selecting the right tools to identifying the most relevant KPIs.
You’re not alone—87% of business leaders say access to real-time data is critical for success, but only a small percentage feel their dashboard setup is optimised to provide those insights (Domo Report).
In this step-by-step guide, we’ll walk you through the process of creating a powerful KPI dashboard.
Whether you’re starting from scratch or refining your current setup, we’ll show you how to track what truly matters to your business, simplify decision-making, and prepare for sustained growth.
#1 Why Every Business Needs a KPI Dashboard
Running a business involves making countless decisions that can determine your success or failure.
However, those decisions can feel like educated guesses without a clear way to measure performance.
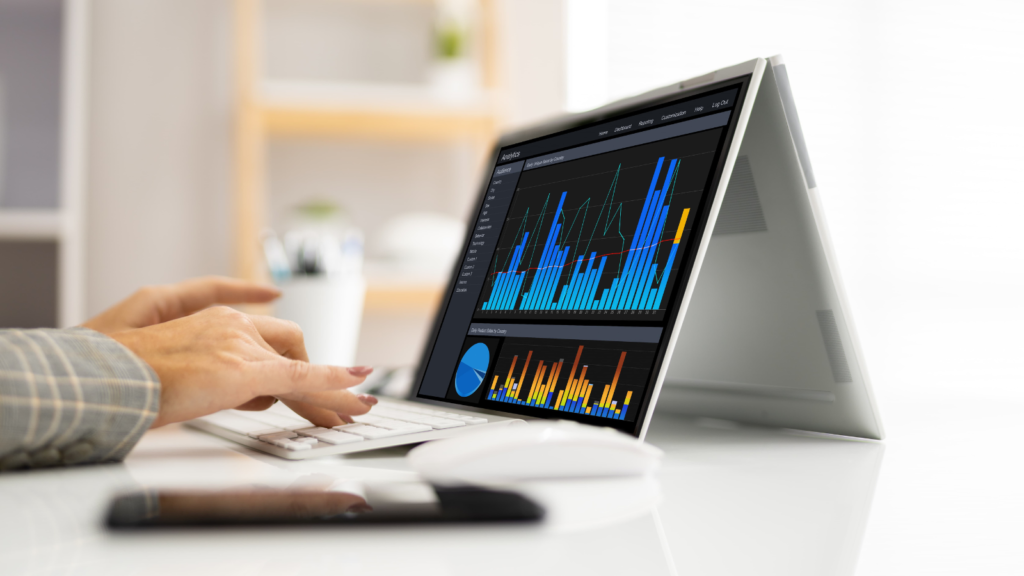
That’s where a KPI dashboard makes all the difference. It provides a straightforward, real-time view of your most important metrics, helping you keep your finger on the pulse of your business and empowering you to make informed, confident decisions.
Simplify Data Overload
With every step your business takes, more data is generated—sales numbers, website traffic, customer behaviour, and beyond. But trying to monitor everything can quickly become overwhelming.
A well-designed KPI dashboard cuts through the clutter by focusing on the core metrics aligning with your business goals, allowing you to zero in on what matters.
Make Decisions in Real Time
Rather than waiting on weekly or monthly reports, a KPI dashboard gives you access to real-time data. This allows you to react quickly to changes in your business—whether it’s adjusting a marketing strategy, reallocating resources, or identifying potential issues before they become major problems.
The ability to make data-driven decisions on the fly gives your business an edge in staying responsive and agile.
Foster Team Alignment and Accountability
When the whole team can see how their efforts contribute to the bigger picture, it creates clarity and drives accountability.
A shared KPI dashboard helps each department understand its role in meeting company goals, improving collaboration, and ensuring everyone is working towards the same objectives.
This level of transparency brings teams together and boosts overall performance.
Track Progress for Continuous Improvement
A key benefit of a KPI dashboard is the ability to track progress over time. By setting benchmarks and targets, you can monitor performance and identify areas for improvement.
This helps you fine-tune strategies, address issues quickly, and continually push your business toward its goals.
Research from Geckoboard shows that 56% of businesses using KPI dashboards have seen significant improvements in decision-making, and they are 33% more likely to achieve their goals.
Step 1: Define Your Business Objectives and Key Metrics
Before you start building your KPI dashboard, it’s essential to have a clear understanding of your business objectives. Without defining what success looks like for your business, tracking data becomes a meaningless exercise.
To get the most value out of your dashboard, the first step is establishing your core goals and identifying the key metrics that will help you measure progress toward those goals.
Align KPIs with Your Business Objectives
Your dashboard should reflect what matters most to your business. Start by identifying your top priorities—whether increasing revenue, improving customer satisfaction, or boosting operational efficiency.
The metrics you choose to track, your Key Performance Indicators (KPIs), should directly relate to these objectives.
For example, KPIs like monthly recurring revenue (MRR) or customer acquisition cost (CAC) might be most relevant if your goal is to grow sales.
If customer experience is your priority, metrics such as net promoter score (NPS) or average resolution time would be more appropriate.
Focus on Actionable Metrics
It’s easy to fall into the trap of tracking too many KPIs, but more data isn’t always better. Focus on a handful of actionable KPIs that give you the information you need to make decisions.
If a KPI doesn’t directly influence your actions or strategy, it’s not worth tracking.
Choose 5-7 core metrics that will provide a clear snapshot of your business’s health.
These metrics should be specific enough to guide actions, such as increasing spending on a successful marketing campaign or tweaking your customer service approach to reduce response times.
Set Clear Benchmarks and Targets
Once you’ve chosen your KPIs, set benchmarks based on past performance or industry standards. These benchmarks will help you understand how your business is performing in relation to your goals.
Additionally, specific targets for each KPI should be set, whether that’s increasing sales by 15% in the next quarter or reducing customer churn by 5%. Having clear targets allows you to gauge success and stay motivated.
Use SMART KPIs
To ensure your KPIs are practical and effective, follow the SMART criteria:
- Specific: Clearly define each KPI.
- Measurable: Ensure the data can be quantified.
- Achievable: Set realistic, attainable goals.
- Relevant: Align KPIs with business priorities.
- Time-bound: Include a timeframe for tracking progress.
For example, rather than simply tracking “sales growth,” you might set a SMART KPI like “Increase monthly sales by 10% over the next quarter.”
This provides a clear, measurable goal that is aligned with your overall objective.
According to a McKinsey study, 70% of executives say that focusing on the right KPIs has significantly improved their company’s performance and decision-making processes.
Step 2: Choose the Right Tools for Your KPI Dashboard
Once you’ve defined your business objectives and identified the key metrics you need to track, the next step is choosing the right tools to build your KPI dashboard.
With a wide variety of tools available, selecting one that aligns with your business needs, data sources, and team’s technical capabilities is important.
The right tool will allow you to visualise your KPIs effectively and provide real-time insights into your business performance.
Consider Your Business Size and Needs
Not all tools are created equal, and your choice should depend on your business size and complexity.
Smaller businesses might need simple, cost-effective tools that offer basic dashboard functionalities. At the same time, larger enterprises may require more advanced platforms with extensive customisation options, real-time data integration, and the ability to manage large datasets.
For example, tools like Google Data Studio or Zoho Analytics might be ideal for smaller companies due to their ease of use and flexibility.
In contrast, larger organisations might benefit from more robust platforms like Tableau or Microsoft Power BI, which offer advanced data visualisation, AI integration, and scalability.
Look for Seamless Integration with Data Sources
A KPI dashboard is only as good as the data it presents, so it’s critical that your chosen tool can seamlessly integrate with your existing data sources. This ensures that your dashboard provides real-time data updates and eliminates the need for manual data entry.
Whether it’s integrating with your CRM system, marketing automation software, or financial tools, a good dashboard tool will pull data from multiple sources into one unified view.
For instance, if your business uses Salesforce for customer management and Google Analytics for web tracking, ensure your dashboard tool can effortlessly connect to these platforms.
Some tools also support APIs, enabling you to create custom data connections where necessary.
Prioritise User-Friendliness and Customization
While advanced features are useful, they can be overwhelming if the tool isn’t intuitive. Choose a dashboard platform that offers an easy-to-use interface and customisable options that fit your specific KPIs and goals.
Your team members should be able to navigate the dashboard easily, view key metrics without confusion, and generate reports as needed.
Customization is also key—look for tools that allow you to customize the dashboard layout, data visualizations, and reporting frequency to your business needs. This ensures your dashboard delivers information in a useful and actionable format.
Evaluate Scalability and Long-Term Use
As your business grows, so will your data needs. Select a tool that can scale with you, providing additional features, integrations, and storage capacity as needed.
It’s important to choose a solution that fits your current requirements and is flexible enough to expand as your business evolves.
Example Tools to Consider:
- Google Data Studio: Ideal for small businesses, offering free, easy-to-use dashboard features with Google Analytics integration.
- Tableau: A powerful tool for larger enterprises, providing sophisticated data visualisation and AI-powered analytics.
- Microsoft Power BI: A highly scalable tool that integrates with various data sources and offers advanced analytics capabilities.
A Forrester report found that businesses using advanced data visualisation tools like Tableau and Power BI are 43% more likely to make informed business decisions faster than those relying on manual reports.
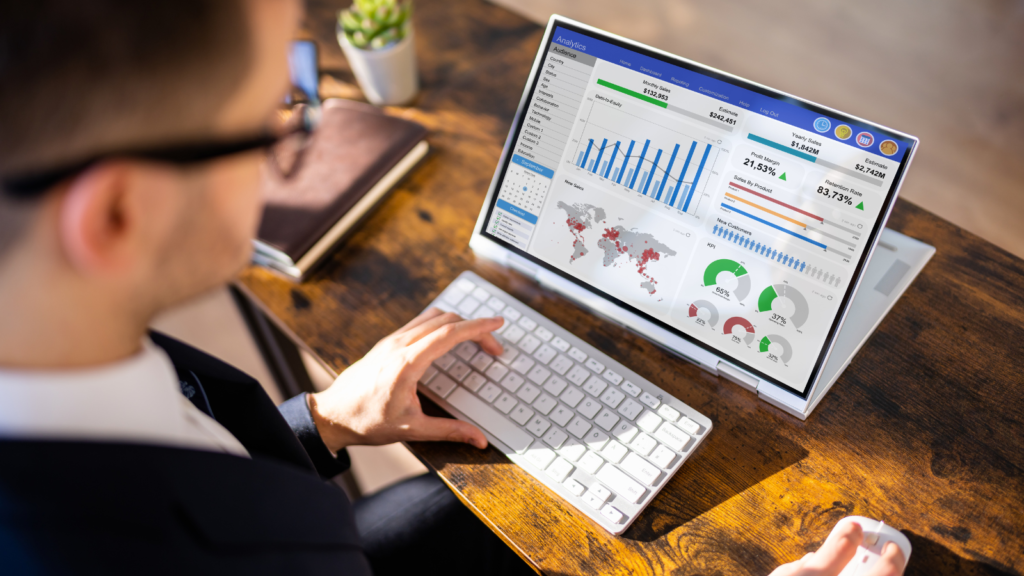
Step 3: Organize Your Data Sources for Real-Time Insights
A KPI dashboard is only as good as the data feeding into it. For it to be a reliable tool in decision-making, you need to ensure that your data sources are well-organized and updated in real time.
This will give you a live view of your key metrics, allowing you to respond quickly to any changes in your business performance.
To build a robust and actionable dashboard, it’s crucial to integrate all your data sources and set them up for seamless, real-time data flow.
Centralise Data from Multiple Platforms
Most businesses use various platforms for different operations—CRM systems, marketing tools, financial software, and more. Centralizing all relevant data sources is the first step to getting a complete overview of your performance.
By integrating data from sales platforms like Shopify, analytics from Google Analytics, financial data from MYOB, and marketing results from GetResponse, you ensure your KPI dashboard provides a comprehensive, 360-degree view of your business.
For example, a retailer might integrate data from Shopify (for sales metrics), Google Analytics (for website traffic), and Facebook Ads (for ad performance).
Centralizing this information in one dashboard allows you to track how website traffic affects sales, which campaigns drive the most conversions, and how your overall revenue stacks up—all in real time.
Automate Data Collection for Real-Time Accuracy
Manually inputting data into a dashboard is time-consuming and can introduce errors. Automating data collection is essential to ensure that your KPI dashboard reflects real-time performance.
Most platforms, such as Google Analytics and Shopify, offer direct integrations with tools like Google Data Studio. For others, you can use third-party services or APIs to sync data from platforms like MYOB or GetResponse automatically.
Automating data collection eliminates the risk of outdated or inaccurate information, ensuring that you’re always working with the most current metrics.
For example, automated data feeds allow you to track sales metrics or customer feedback in real time, helping you pivot quickly when necessary.
Ensure Data Consistency and Standardization
Inconsistent data can lead to misinterpretation of your KPIs. To avoid this, ensure all your data sources are standardised and consistent.
This includes ensuring that all revenue data is recorded in the same currency, time periods are aligned across platforms, and customer information is consistently categorised.
Clean and consistent data means that the insights provided by your dashboard will be actionable and trustworthy.
For instance, if your business operates in multiple countries, ensure that sales data is converted into a common currency.
Additionally, if you’re tracking leads from various marketing platforms, standardise how lead quality or conversions are categorised across all channels.
Use APIs for Custom Data Integration
If you’re using custom or niche software that doesn’t have a built-in integration, APIs (Application Programming Interfaces) can help you link these platforms to your dashboard.
APIs allow different systems to communicate with each other, enabling you to pull in data from nearly any source into your dashboard.
For example, if you have proprietary software for tracking warehouse operations, you can use an API to pull that data into your KPI dashboard alongside sales and marketing metrics. This ensures that every aspect of your business is captured in real-time.
According to a report by Deloitte, 49% of businesses say that improved data integration has significantly increased their ability to make real-time, data-driven decisions, leading to higher business agility.
Step 4: Design a User-Friendly Dashboard Layout
A KPI dashboard is only as effective as its layout. Even with accurate, real-time data flowing in, you won’t get the full benefit if the dashboard is cluttered or difficult to interpret.
Designing a user-friendly, intuitive layout is crucial to making the data actionable.
A well-designed dashboard lets you quickly understand your key metrics and make decisions without confusion or wasted time.
Keep It Simple and Focus on Key Metrics
The most effective dashboards are simple and uncluttered. Rather than displaying every available metric, focus on the 5-7 most important KPIs directly impacting your business goals.
Overloading your dashboard with too much information can make it harder to interpret and distract from the core insights.
For example, if your goal is to increase sales, focus on KPIs like conversion rate, average order value, and customer acquisition cost rather than trying to track every available metric. This lets you focus on what matters most and make informed decisions faster.
Use Clear Visualizations for Easy Interpretation
One of the strengths of a dashboard is its ability to turn raw data into visual insights.
Use charts, graphs, and colour-coded indicators to make your data easy to digest at a glance.
Bar charts are great for comparing metrics over time, while pie charts can show distribution or market share. Line graphs can be used to track trends and changes in key metrics over time.
For instance, if you’re tracking website traffic from multiple sources, a pie chart can quickly show the percentage of traffic from organic search, social media, and paid ads, helping you allocate resources effectively.
Group Similar KPIs Together
To make your dashboard intuitive, group related KPIs together. This makes it easier to draw connections between metrics and see how they influence one another.
For example, group marketing KPIs like click-through rate (CTR) and conversion rate in one section and place financial KPIs like profit margins and cost of goods sold (COGS) in another.
This logical grouping helps you stay organised and quickly locate the information you need to make decisions.
Add Filters for Customization
Not every team member or stakeholder will need the same data. By adding filters, you can customise the dashboard view based on what’s relevant to the user.
For example, you can filter your KPIs by time period (e.g., daily, weekly, monthly) or by department (e.g., sales, marketing, finance).
Filters allow you to zoom in on specific aspects of your business while keeping the overall view simple and clear. This customisation is particularly useful for larger teams, where different departments may need different insights.
Ensure Mobile and Cross-Device Compatibility
In today’s world, business decisions often must be made on the go. Ensure that your KPI dashboard is fully responsive, meaning it adapts well to different screen sizes, from desktops to mobile devices.
A responsive dashboard ensures that whether you’re in the office, at home, or travelling, you can easily access and interpret your key metrics without the layout breaking down or becoming unreadable.
Example of an Effective Layout:
An e-commerce business might design a layout where:
The top section shows a sales overview with KPIs like total sales, conversion rate, and average order value displayed using large, easy-to-read scorecards.
The middle section focuses on customer acquisition with line graphs showing traffic sources, customer growth, and customer lifetime value.
The bottom section visualises financial performance, using bar charts to track monthly revenue vs. expenses.
According to Adobe research, well-designed dashboards can increase user engagement with data by 60%, helping teams make faster, more effective decisions.
Step 5: Set Benchmarks, Targets, and Alerts for Continuous Improvement
Once your KPI dashboard is up and running with the right metrics and an intuitive layout, the next step is to ensure that it actively drives your business toward growth.
Setting benchmarks, defining targets, and implementing alerts becomes crucial.
These features allow you to track progress in real-time, anticipate potential problems, and continuously improve performance.
Set Clear Benchmarks Based on Historical Data
Benchmarks provide a point of reference for evaluating your current performance. To set meaningful benchmarks, start by analysing historical data from previous months or years.
This allows you to compare current performance with past results and identify trends or areas for improvement.
For example, if your average monthly revenue over the past year was $150,000, that becomes your benchmark. You can then track whether you consistently meet, exceed, or fall short of this baseline.
By understanding where you’ve been, you can better plan where you’re going.
Establish Specific Targets for Each KPI
Setting specific targets for each KPI ensures that your dashboard isn’t just monitoring performance but driving it. These targets should be aligned with your broader business goals.
Make sure they are SMART: Specific, Measurable, Achievable, Relevant, and Time-bound.
For example:
- Increase monthly sales by 15% in the next quarter.
- Reduce customer churn by 5% within six months.
- Increase website conversion rate from 2.5% to 3.5% by the end of the year.
By setting measurable targets, your team has clear goals to work toward. This turns your dashboard from a passive reporting tool into an active driver of growth.
Implement Alerts for Early Warnings
Even with clear targets, performance can sometimes deviate unexpectedly. To stay proactive, set up alerts within your dashboard that notify you when certain KPIs fall outside of the acceptable range.
This allows you to take immediate action before small issues turn into major problems.
For instance, you can set up alerts for:
- A sudden drop in website traffic below a certain threshold.
- Customer satisfaction scores falling below a set benchmark.
- Marketing campaign costs exceeding your target CPA (cost per acquisition).
Alerts ensure you’re always informed about critical changes and allow you to act quickly, whether by tweaking a marketing campaign, addressing customer service issues, or reallocating resources.
Regularly Review and Adjust Your Targets
As your business grows and evolves, so should your targets. It’s important to regularly review your KPIs and adjust them to reflect new business realities, market conditions, or seasonal trends.
By doing this, your KPI dashboard will always stay relevant and focused on the areas that matter most.
For example, if you’ve consistently met your goal of increasing monthly sales by 15%, it might be time to raise the bar to 20% for the next quarter. Alternatively, if certain targets aren’t being met, it may be time to reassess your strategies and set more achievable goals.
According to a study by ClearPoint Strategy, 74% of businesses that set and regularly review performance targets see faster improvements in their key metrics compared to those that don’t set defined targets.

Step 6: Test, Optimize, and Keep Your Dashboard Updated
Building an effective KPI dashboard doesn’t end once it’s live. To truly maximise its value, you must continually test, optimise, and ensure that your dashboard remains up-to-date with your evolving business needs.
Regularly refining your dashboard ensures that it stays relevant, reflects the most critical metrics, and delivers actionable insights.
Regularly Test Your Dashboard’s Functionality
It’s important to regularly test your KPI dashboard to ensure that it is working as expected.
This means checking that the data sources are connected correctly, the visualisations are updated in real-time, and the information presented is accurate and easy to interpret.
For example, you might run periodic checks to ensure that your sales metrics from Shopify or financial data from MYOB are accurately reflected in the dashboard.
If any data is lagging or displaying incorrectly, it’s crucial to address the issue quickly to maintain the reliability of the insights.
Gather Feedback from Users
Your dashboard may be used by various business stakeholders, such as managers, marketing teams, financial analysts, etc. It’s important to gather feedback from these users to understand whether the dashboard meets their needs.
Are the key metrics easy to find and understand? Is the data being displayed in a way that drives action? Is there anything missing?
For example, your marketing team might request a different visualisation for campaign performance metrics or suggest adding a filter for more granular analysis. Regular feedback helps ensure the dashboard is as useful as possible.
Optimise for Changing Business Needs
As your business evolves, so will your data needs. What was relevant six months ago might no longer reflect your current priorities.
It’s essential to periodically review the KPIs being tracked and adjust them to align with your current goals.
For example, if you’re launching a new product, you might want to track customer acquisition or time-to-purchase more closely. Alternatively, if your focus has shifted from growth to profitability, you might prioritise metrics like profit margin or operating expenses.
Optimizing your dashboard means ensuring it reflects the current phase of your business, keeping you focused on the metrics that matter most.
Update Data Sources as Needed
If your business adopts new tools or platforms, it’s essential to integrate them into your KPI dashboard so that you have a comprehensive view of your operations.
As you add new tools, such as switching from one marketing automation platform to another or integrating new CRMs, ensure these data sources are added to your dashboard.
For instance, if you start using HubSpot for marketing or customer data, you’ll want to ensure that HubSpot’s data integrates smoothly into your dashboard. This will ensure that you’re not missing out on key insights from new tools.
Stay Flexible with Visualizations
Sometimes, the way data is presented can make all the difference. Be flexible with your visualisations and experiment with different charts, graphs, and tables to see what works best for your team.
For example, heat maps work better for tracking customer behaviour on your website, while bar charts are more effective for comparing month-to-month sales data.
Regularly experimenting with how you visualize your data ensures that your dashboard remains clear and impactful, allowing teams to act more effectively on insights.
A Forrester report found that businesses that regularly optimize their dashboards are 70% more likely to make faster, data-driven decisions than those that let their dashboards remain static over time.
Conclusion
A well-designed KPI dashboard can transform how you manage and grow your business.
By focusing on the right metrics, integrating your data sources, and maintaining a clean, intuitive layout, you can gain the clarity needed to make informed decisions and monitor your performance in real time.
Using the steps outlined in this guide, you can create a dashboard that tracks your key objectives and drives continuous improvement.
Here’s a quick recap of what we covered:
- Start by defining your business objectives and identifying the most critical KPIs to track.
- Choose the right tools to integrate and visualise your data effectively.
- Organise your data sources to ensure you’re pulling in real-time insights.
- Design a user-friendly dashboard layout that emphasises clarity and simplicity.
- Set benchmarks, targets, and alerts to keep your performance on track.
- Regularly test, optimise, and update your dashboard to stay relevant to your evolving business needs.
By taking these steps, you’ll have a dashboard that is a powerful tool for tracking progress, making strategic adjustments, and ultimately driving growth.
Ready to build your KPI dashboard?
Start today by outlining your key metrics and exploring the right tools to integrate your data.
Stay ahead of the competition by leveraging real-time insights that empower you to make smarter, faster decisions.
FAQs
Q1: What is a KPI dashboard, and why do I need one?
A1: A KPI dashboard is a visual tool that displays your most important Key Performance Indicators (KPIs) in real-time, allowing you to monitor your business’s performance at a glance. It helps you track progress, make data-driven decisions, and identify areas for improvement.
Q2: How do I choose the right KPIs for my dashboard?
A2: Start by identifying your business objectives. The right KPIs should align with these goals and provide actionable insights. For example, if your goal is to increase revenue, you might track metrics like sales growth, conversion rates, and customer acquisition costs.
Q3: What tools can I use to build a KPI dashboard?
A3: There are several tools available, including Google Data Studio, Tableau, and Power BI. These tools allow you to integrate data from multiple sources and create custom dashboards tailored to your business’s needs.
Q4: How often should I update my KPI dashboard?
A4: To get the most accurate insights, it’s important to update your dashboard regularly, ideally in real time. Most modern dashboard tools allow you to automate data syncing so that your dashboard is continuously updated with the latest metrics.
Q5: How do I ensure my dashboard stays relevant as my business grows?
A5: Regularly review and update the KPIs you’re tracking to ensure they align with your evolving business goals. You should also gather feedback from team members who use the dashboard and adjust the layout, visualizations, or data sources as needed.
Q6: Can I integrate data from different platforms (e.g., Google Analytics, Shopify, MYOB) into one dashboard?
A6: Yes, most dashboard tools allow you to integrate data from multiple platforms using APIs or third-party connectors. This ensures that you can track all your key metrics—sales, marketing performance, and financial data—in one place.
Q7: How can I use my KPI dashboard to drive continuous improvement?
A7: By setting benchmarks and targets, you can track your performance against clear goals. Additionally, implementing alerts for when KPIs fall outside of expected ranges allows you to take quick action to correct any issues.
Other Articles
Discover Key Steps to Improve Your Marketing Workflows
Essential KPI Dashboard Elements for Smarter Business Growth
