You can access vast amounts of data as an SME owner, but the challenge lies in turning that data into actionable insights.
In this article, we will provide you with a roadmap for harnessing the power of analytics, enabling you to make data-driven decisions that propel your business forward.

The Power of Data-Driven Decision Making
In today’s digital age, data is the new currency. It holds the potential to unlock hidden opportunities, reveal customer preferences, and identify emerging trends.
As an SME owner, embracing data-driven decision-making can give you a competitive edge in the market.
Here’s why:
Insights for Better Understanding:
Analytics allow you better to understand your customers, their behaviours, and preferences.
By analysing customer data, you can identify patterns, segment your audience, and tailor your products or services to meet their specific needs.
For example, you may discover that many customers prefer online shopping by examining purchase history and browsing patterns. With this knowledge, you can allocate resources to enhance your e-commerce platform, ensuring a seamless shopping experience.
Identifying Growth Opportunities:
Data analytics can uncover untapped market segments, niche opportunities, or emerging trends.
By analysing industry trends and market data, you can identify areas where demand is growing and position your business to capture those opportunities.
For instance, an analysis of your sales data may reveal a surge in demand for eco-friendly products. Armed with this insight, you can develop a line of sustainable products and target environmentally-conscious consumers.
Optimising Operations:
Data-driven decision-making extends beyond customer insights.
It also empowers you to optimise your business operations. You can identify bottlenecks, streamline processes, and reduce costs by analysing internal data such as production metrics, inventory levels, and supply chain performance.
For example, by analysing production data, you may discover that certain manufacturing processes are inefficient and lead to higher production costs. With this knowledge, you can restructure your production workflow, saving time and money.
Take Action: The Four Steps to Turning Analytics into Action
Now that you understand the value of data-driven decision-making let’s explore a four-step process to help you turn analytics into actionable insights.
By following these steps, you can harness the power of data and make informed decisions that propel your business forward.
Step 1: Define Clear Business Objectives
Before diving into data analysis, it is crucial to define clear business objectives.
Ask yourself what you want to achieve and how data can support those goals.
Some common business objectives may include:
Increasing sales revenue
Improving customer satisfaction and loyalty
Optimising operational efficiency
Expanding into new markets
By defining your objectives, you can focus your analysis efforts on the data that will drive meaningful insights aligned with your goals.
Example: Suppose you run a clothing boutique and want to increase sales revenue. Your objective could be identifying the most popular product categories and developing targeted marketing campaigns to drive sales in those areas.
Step 2: Gather and Analyze Relevant Data
With your business objectives in mind, it’s time to gather the relevant data that will help you gain insights.
Start by identifying the sources of data available to you, such as:
Sales records
Customer databases
Website analytics
Social media metrics
Surveys and feedback
Collecting data from various sources gives you a holistic view of your business and customers.
Once you have the data, it’s time to use appropriate analytical tools and techniques. If you’re new to data analysis, consider leveraging user-friendly analytics platforms that offer easy-to-use interfaces and automated insights.
Example: In our clothing boutique example, you could gather data from your sales records, website analytics, and customer databases. By analysing this data, you can identify the top-selling product categories, customer preferences, and purchase patterns.
Step 3: Extract Actionable Insights
Data analysis is not merely about numbers and charts; it’s about extracting actionable insights that inform your decision-making. Look for patterns, trends, and correlations within your data to guide your actions.
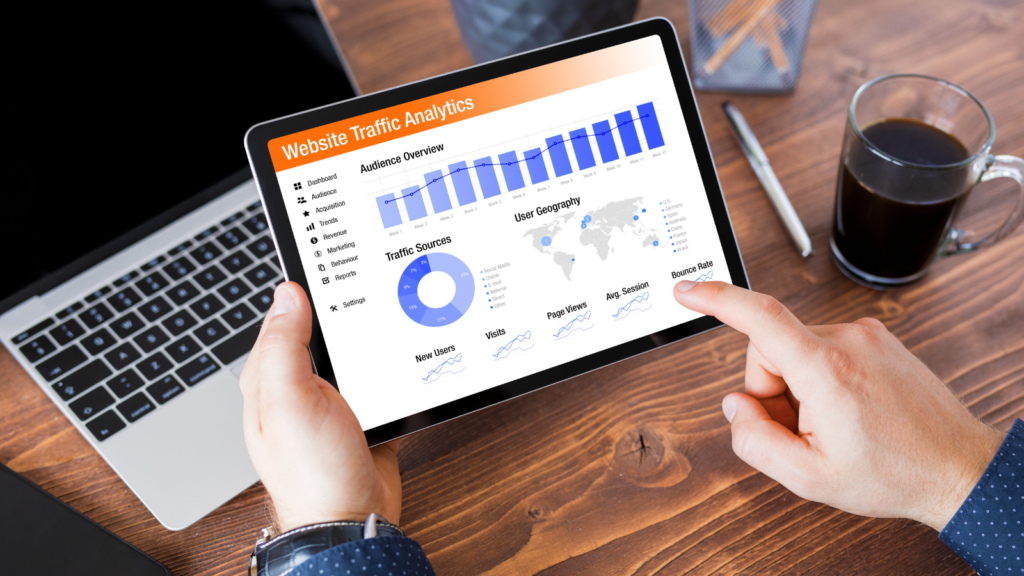
This is where data visualisation techniques such as charts, graphs, and dashboards become invaluable.
Visual representations of data make it easier to spot trends and communicate insights effectively.
Example: Analyzing the data from the clothing boutique, you may discover that women’s dresses and accessories are the top-selling product categories. Additionally, customers who purchase dresses tend to buy accessories as well. With this insight, you can create targeted marketing campaigns highlighting dress-and-accessory bundles, driving cross-selling opportunities.

Step 4: Implement and Iterate
Once you have actionable insights, it’s time to implement them and monitor the results.
Implementing data-driven decisions involves aligning your resources, processes, and strategies with the identified opportunities.
Monitor the outcomes closely and track key performance indicators (KPIs) to evaluate the impact of your decisions.
Remember that data-driven decision-making is an iterative process. Continuously analyse the results and refine your strategies based on new insights and changing market dynamics.
Example: In our clothing boutique example, you would implement the targeted marketing campaigns for dress-and-accessory bundles. Monitor the sales performance of these campaigns and track metrics such as conversion rates and revenue generated.
Based on the results, you can refine your marketing strategies and iterate on the approach to maximise the impact.
By following these steps, you are well on your way to leveraging data to make informed decisions that drive growth and success.
FAQs
Q: What if I don’t have access to advanced analytics tools?
A: While advanced analytics tools can provide more sophisticated insights, you can still start with basic data analysis techniques. Utilise spreadsheet software like Microsoft Excel or Google Sheets to analyse your data. These tools offer built-in functions and visualisation options to help you gain valuable insights without advanced analytics capabilities.
Q: How frequently should I analyse my data?
A: The frequency of data analysis depends on various factors, such as the nature of your business, the availability of data, and the pace of market changes.
Generally, it is recommended to analyse your data regularly, whether weekly, monthly, or quarterly. Regular analysis allows you to detect trends and patterns in a timely manner, enabling you to make agile decisions to stay ahead of the competition.
Q: What if I don’t have enough data to perform the analysis?
A: Lack of data can be a challenge, especially for new businesses or niche markets. Consider leveraging external data sources or conducting surveys to gather additional insights in such cases. Look for industry reports, market research studies, or government data that complement your internal data. Remember, even a small amount of data can provide valuable insights if analysed strategically.
Conclusion
In conclusion, turning analytics into action is critical for SME owners in today’s data-driven world.
By embracing data-driven decision-making, you can unlock valuable insights, identify growth opportunities, and optimise your operations.
Remember to define clear business objectives, gather and analyse relevant data, extract actionable insights, and implement your findings.
Continuously monitor the results, refine your strategies, and iterate on your approach. By following these steps, you will harness the power of analytics to make informed decisions that drive your business’s success.

