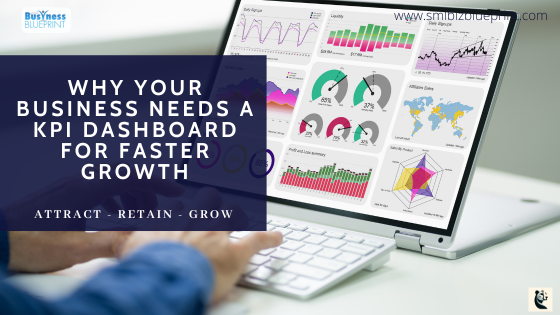
In today’s data-driven business landscape, making informed decisions quickly can be the difference between thriving and simply surviving.
Yet many businesses struggle to harness the full potential of their data. That’s where a KPI dashboard comes into play. According to a Forbes study, businesses that use real-time data analytics are five times more likely to make faster decisions than their competitors.
A well-designed KPI dashboard provides a comprehensive, visual overview of your business performance, helping you boost productivity, align your team on key objectives, and ultimately drive better business outcomes.
This post will explore why every business needs a KPI dashboard and how these powerful tools can transform data into actionable insights.
We’ll discuss how a KPI dashboard consolidates all your critical metrics in one place, enhances decision-making with real-time updates, and leverages AI for predictive analytics—all to keep your business ahead of the competition.
Let’s dive into the benefits of KPI dashboards and why they’re essential for every business striving for growth and success.

#1 The Power of Real-Time Insights: How a KPI Dashboard Transforms Decision-Making
Every business makes decisions daily, from small operational tweaks to major strategic shifts. However, how quickly and accurately you make those decisions can significantly impact your business outcomes.
Relying on outdated data or manual reports can lead to missed opportunities and slow responses to market changes.
This is where a KPI dashboard becomes a game-changer, providing real-time insights that enable proactive decision-making.
Imagine running your business like driving a car. Without a dashboard to show your speed, fuel level, and other crucial information in real time, you’d be navigating blindly, reacting to issues only when they become apparent.
Similarly, a KPI dashboard gives your business a clear, immediate view of your most important metrics, allowing you to spot opportunities and challenges as they arise.
Quick Adaptation and Data-Driven Decisions
The key advantage of real-time data is the ability to adapt quickly. A KPI dashboard allows businesses to monitor live data streams across sales, marketing, operations, and finance, providing an integrated view of performance.
This real-time perspective empowers teams to:
- Identify trends as they emerge to capitalise on positive patterns or promptly address negative shifts.
- Improve response time, allowing you to seize opportunities, such as increasing inventory when a product is trending or ramping up marketing during peak engagement times.
- Make informed decisions confidently, knowing you’re acting on the most current information available.
Minimising Risks and Enhancing Forecasting
With the ability to view up-to-the-minute data, businesses can quickly identify issues before they escalate. For example, if sales figures fall below targets, a KPI dashboard can quickly reveal which products are underperforming, which marketing channels are less effective, or where operational bottlenecks may exist.
These insights allow you to address problems swiftly, minimising the risk of significant losses.
Moreover, real-time dashboards, especially those enhanced with AI, don’t just provide current metrics—they offer predictive analytics.
A KPI dashboard can forecast future outcomes, such as sales trends, customer behaviour, and inventory needs, by analyzing historical data and trends.
This predictive power allows businesses to plan more effectively, allocate resources efficiently, and stay ahead of market demands.
A Competitive Advantage for Growing Businesses
The ability to monitor KPIs in real-time ensures that you stay informed and gives your business a competitive edge.
Companies that use real-time data insights are 33% more likely to outperform their competitors regarding efficiency and profitability (Forrester).
A KPI dashboard transforms data into actionable insights, helping you anticipate market changes, make better decisions faster, and adapt to customer needs before your competitors even see them coming.
In a world where timing and precision matter, having real-time access to your business’s KPIs is no longer a luxury—it’s a necessity.
#2 From Data Overload to Visual Clarity: Making Sense of Your Business Metrics
In today’s digital age, businesses can access more data than ever. However, too much data without a clear way to analyse and understand it can lead to data overload.
Sifting through spreadsheets, reports, and multiple analytics platforms to understand your metrics can be time-consuming and overwhelming.
This is where a KPI dashboard simplifies and transforms how you view and interpret your business data.
Consolidating Data into One Central Hub
One of the primary advantages of a KPI dashboard is its ability to consolidate all your key business metrics into one place. Instead of jumping between marketing analytics, sales reports, financial summaries, and customer feedback tools, you have a single source of truth.
This consolidation:
- Eliminates Data Silos: Breaks down departmental barriers by integrating data from various sources into a unified dashboard. Teams can access the same information, leading to better collaboration and alignment.
- Improves Data Consistency: Ensures everyone looks at the same numbers, reducing the risk of misinterpretation or outdated data.
- Saves Time and Effort: It allows you to focus on analysing data and making decisions rather than collecting, organising, and reporting data manually.
Making Data Easy to Digest with Visualizations
Numbers alone don’t tell the full story—the visualisation makes data meaningful. A KPI dashboard turns complex datasets into easily understandable charts, graphs, and tables.
This approach taps into the brain’s natural ability to process visual information much faster than text or raw numbers.
In fact, the human brain processes visuals 60,000 times faster than text (HubSpot).
By converting data into visual elements, a KPI dashboard enables businesses to:
- Spot Trends and Patterns: Visualizing data through line graphs, bar charts, and pie charts makes it easy to identify trends, growth patterns, or declines in specific KPIs over time.
- Quickly Compare Metrics: Visual comparisons reveal insights that might be missed in raw data, whether you’re tracking month-over-month revenue growth or analysing marketing channel performance.
- Highlight Key Takeaways at a Glance: Heat maps, scorecards, and colour-coded indicators instantly draw attention to significant changes or outliers, making it simple to interpret what’s working and what needs attention.
Driving Informed Decisions through Simplified Insights
A well-designed KPI dashboard breaks down complex information into clear, actionable insights. Instead of wasting time interpreting large data sets, your team can quickly understand the current state of the business and make decisions accordingly.
For instance:
- A marketing team can track campaign performance in real-time, allowing them to adjust if certain channels are underperforming.
A sales team can view the sales pipeline, identify top-performing sales reps, and strategise how to close deals faster. - A KPI dashboard presents data in an intuitive, visual format, empowering everyone in your organization to make decisions based on clear, accessible information.
A recent study found that businesses using data visualisation tools are 28% more likely to find the information they need quickly and act on it effectively (Aberdeen Group).
With visual clarity at its core, a KPI dashboard is a powerful tool for simplifying data analysis and helping you stay focused on what matters most for your business’s growth.
#3 Boosting Productivity and Accountability with a Centralized KPI Dashboard
Manual reporting and data collection can drain a business’s productivity. Teams often spend valuable hours gathering information from multiple systems, double-checking numbers, and preparing reports.
Not only is this process time-consuming, but it can also lead to inconsistencies and data inaccuracies.
By centralising all your key performance indicators into a KPI dashboard, you can enhance productivity and establish clear accountability across your organisation.
Automating Data Collection for Efficiency
A KPI dashboard automates the data collection process, eliminating the need for manual updates.
Whether you’re pulling metrics from your CRM, marketing analytics platform, or accounting software, an automated dashboard consolidates these data streams into one live interface.
The benefits of this automation include:
- Saving Time on Reporting: With data automatically feeding into the dashboard, teams can quickly access up-to-date metrics without manually exporting and compiling data.
- Reducing Human Error: Manual data entry is prone to mistakes that can skew metrics and affect decision-making. Automation ensures accuracy by pulling data directly from the source.
- Focusing on Analysis, Not Data Gathering: Teams can spend time analysing insights and making strategic decisions instead of chasing down information and preparing reports.
This approach to automating data collection results in streamlined workflows, enabling your team to focus on higher-value tasks that drive business growth.
Enhancing Accountability with a Transparent Dashboard
Transparency is key to driving accountability in any business. A KPI dashboard makes it easy for all team members to track their performance in real time, understand how their efforts impact business goals, and take ownership of their results.
Here’s how:
- Clear Ownership Over KPIs: Each team member or department can clearly see the KPIs they’re responsible for, creating an environment where everyone is aligned on their contributions to the business.
- Performance Tracking for Motivation: Viewing live performance data—whether daily sales numbers, customer satisfaction scores, or project timelines—can be motivating. It pushes teams to stay on top of their targets and react quickly if progress falls behind.
- Easy Performance Reviews and Goal Setting: A KPI dashboard provides a reliable historical performance record, making it easier to conduct reviews and set future goals. The dashboard’s transparency fosters a culture of continuous improvement.
Better Team Collaboration and Cross-Functional Insights
Centralising your data in a KPI dashboard promotes collaboration across teams.
When different departments have access to shared data and metrics, it opens up opportunities for cross-functional insights:
- Marketing and Sales Alignment: Marketing teams can use sales KPIs to measure the quality of leads generated, while sales teams can better understand which marketing channels drive the most conversions.
- Operations and Finance Coordination: Operations can track project costs in real time, ensuring they align with financial goals and budgets.
- Breaking Down Silos: A unified dashboard encourages different teams to understand how their roles impact overall business performance and drives a sense of collective accountability.
According to a Gartner study, businesses that use a centralized KPI dashboard see up to a 30% increase in efficiency and spend significantly less time on data gathering and reporting.
With a KPI dashboard, your business can eliminate manual processes, encourage transparency and accountability, and ultimately drive better performance and productivity across all teams.

#4 Aligning Goals and Tracking Progress: The Benefits of Monitoring KPIs
Achieving your business goals requires more than just setting targets; it’s about tracking progress toward those goals in real-time.
A KPI dashboard is a powerful tool for aligning your team’s efforts with your company’s objectives, ensuring everyone stays focused on the same key outcomes.
KPI dashboards offer a transparent view of performance, helping you track progress, identify roadblocks early, and celebrate milestones. These actions effectively drive your business forward.
Keeping Teams Aligned with Business Goals
When everyone in your organisation understands the goals they’re working toward, productivity and focus naturally improve.
A KPI dashboard enables teams to see how their daily activities connect to the overall business objectives, creating a sense of unity and purpose:
- Clarity on Key Metrics: A well-structured KPI dashboard highlights the most critical metrics that drive your business, making it easy for each department to understand their contribution to broader goals. For example, a sales team might track revenue targets, while the customer support team focuses on customer satisfaction scores.
- Consistency Across Departments: With all teams accessing the same dashboard, there is no confusion about the company’s priorities. Every department has visibility into shared goals, reducing miscommunication and fostering collaboration.
- Accountability for Goal Achievement: When KPIs are easily accessible, individual contributors and teams can quickly see their performance against set benchmarks, encouraging accountability and driving continuous improvement.
Tracking Progress to Stay on Course
Tracking KPIs is crucial for measuring progress toward your goals.
Without regular monitoring, it’s easy to miss early warning signs of potential issues or opportunities for improvement. KPI dashboards allow you to:
- Visualise Progress in Real-Time: Dashboards provide a visual representation of progress, whether it’s toward quarterly sales targets, customer acquisition goals, or project completion milestones. This visibility makes it easier to gauge whether you’re on track or need to make adjustments.
- Adjust Strategies Quickly: If certain KPIs are lagging, the dashboard helps you quickly pinpoint where the issue lies. For example, if sales numbers are below target, you can analyze related KPIs like lead conversion rates, average deal size, and sales pipeline health to make informed decisions about pivoting strategies.
- Celebrate Wins and Boost Morale: Dashboards make it easy to recognise achievements as they happen. Tracking progress in real-time means teams are more likely to celebrate hitting milestones, keeping morale high and motivation strong.
Setting and Measuring SMART Goals
A KPI dashboard is particularly effective when aligned with SMART goals—specific, measurable, achievable, relevant, and time-bound.
By setting SMART KPIs within your dashboard, you can:
- Define Clear Targets: Whether it’s growing revenue by a certain percentage, acquiring a set number of new customers, or reducing customer churn, having clear targets makes it easier to measure success.
- Enable Measurable Tracking: The dashboard’s visual and data-driven approach lets you easily track your progress toward each SMART goal.
- Adjust Timelines and Expectations: If certain KPIs aren’t progressing as expected, your dashboard can help you reevaluate goals and timelines, ensuring they remain realistic and aligned with current business capabilities.
According to a McKinsey report, businesses that regularly track KPIs and align them with their goals see a 10-25% improvement in team performance. This improvement comes from a clearer focus on priorities, enhanced goal visibility, and better overall team coordination.
With a KPI dashboard, your team has a centralised place to align around goals, track progress, and make adjustments as needed—all essential for driving sustained business success.
#5 AI-Enhanced Dashboards: Leveraging Predictive Analytics for Business Growth
In today’s rapidly evolving market, having a dashboard showing what’s already happened isn’t enough to maintain a competitive edge.
By integrating AI capabilities into your KPI dashboard, you can move beyond static data and gain access to predictive analytics that help you anticipate trends, optimise operations, and confidently make data-driven decisions.
This AI enhancement transforms your dashboard into a proactive tool, providing forward-looking insights that traditional dashboards can’t offer.
Predicting Trends for Informed Decision-Making
One of the most powerful features of AI-enhanced dashboards is their ability to predict future trends based on historical data and current patterns.
By analysing large volumes of data, AI can uncover patterns that might not be immediately obvious and forecast outcomes, helping you to:
- Anticipate Market Changes: Whether it’s predicting customer behaviour, seasonal sales spikes, or industry shifts, AI-powered dashboards help you stay one step ahead by identifying potential opportunities and risks before they happen.
- Optimise Inventory and Resources: Predictive analytics can forecast demand for specific products for product-based businesses, enabling more accurate inventory management. This helps reduce the chances of stockouts or overstocking, which can tie up cash flow and storage space.
- Forecast Revenue and Performance: AI-enhanced dashboards help you project future revenue, set realistic sales goals, and allocate resources effectively by modelling sales data and identifying trends.
Identifying Actionable Insights Quickly
AI isn’t just about predicting the future—it also makes it easier to interpret and act on current data by generating actionable insights.
Through advanced analytics, AI-enhanced KPI dashboards can:
- Automatically Spot Anomalies: AI algorithms can detect unusual spikes, dips, or patterns in your KPIs, notifying you in real time to take action. For example, if your dashboard spots a sudden increase in customer churn, you can investigate the cause and implement corrective measures quickly.
- Provide Prescriptive Recommendations: Some AI-powered dashboards offer prescriptive analytics, highlighting issues and recommending specific actions to improve performance. For instance, if a marketing channel is underperforming, the dashboard might suggest reallocating the budget to higher-converting channels.
- Save Time with Automated Analysis: Instead of spending hours analysing data to find the “why” behind your KPIs, AI can instantly interpret complex data sets and highlight the key drivers influencing your business performance.
Improving Decision-Making Across Teams
The predictive and prescriptive capabilities of AI-enhanced KPI dashboards empower every team to make smarter decisions:
- Sales Teams can forecast customer demand and prioritise the most promising leads, improving conversion rates and overall sales efficiency.
- Marketing Teams can leverage predictive insights to optimise campaign timing, allocate budgets more effectively, and better understand which channels drive the highest ROI.
- Operations Teams can use AI-driven insights to streamline processes, forecast production needs, and improve resource allocation.
Integrating AI into your dashboard allows every department to leverage predictive analytics to achieve their objectives, ultimately driving business growth more efficiently.
According to Deloitte, 60% of businesses plan to adopt AI for data insights by 2025, aiming to improve decision-making and business performance through enhanced predictive analytics.
With AI-powered capabilities, your KPI dashboard becomes a dynamic tool that doesn’t just show you what happened yesterday but helps you plan and act for a more successful tomorrow.
#6 How KPI Dashboards Drive Better Team Collaboration and Performance
In any business, teamwork and alignment are key to achieving goals and driving growth. However, silos and a lack of transparent communication between departments can slow down progress and impact overall performance.
A KPI dashboard is a unifying tool that fosters collaboration across teams, providing a shared view of essential metrics and progress toward business goals.
This transparency improves accountability and boosts performance by aligning everyone’s efforts.
Creating a Unified Source of Truth
A KPI dashboard consolidates data from various teams, giving everyone in the organisation access to the same set of metrics.
This creates a “single source of truth,” breaking down data silos and ensuring consistency in how performance is measured:
- Improving Cross-Department Collaboration: When sales, marketing, finance, and operations all access the same dashboard, they can see how their activities impact one another. For example, the sales team can understand how marketing campaigns drive leads, while marketing can assess the quality of those leads based on sales conversions.
- Aligning on Goals and Performance: With shared KPIs displayed in real-time, every team member knows which metrics matter most, how the company is performing, and what they need to do to hit targets. This alignment encourages teams to work together toward common objectives and promotes a sense of shared responsibility.
Encouraging Transparency and Accountability
Transparency in business is key to building trust and promoting accountability.
A KPI dashboard provides visibility into individual and team performance, helping everyone understand their contribution to the overall success of the company:
- Clear Ownership of Results: When team members can see their performance against key metrics, they are more likely to take ownership of their results. This drives accountability and encourages proactive behaviour when improvements are needed.
- Tracking and Celebrating Milestones Together: Dashboards make it easy to see when goals are being met. Celebrating these wins as a team, whether it’s hitting a sales target, launching a new product, or improving customer satisfaction, fosters a culture of recognition and keeps teams motivated.
- Instant Feedback for Continuous Improvement: Real-time data allows teams to receive immediate feedback on their performance. If a KPI is underperforming, it becomes immediately apparent on the dashboard, and teams can discuss solutions, brainstorm ideas, and implement strategies quickly to get back on track.
Improving Communication and Driving Performance
Effective communication is essential for any high-performing team, and a KPI dashboard can help by ensuring that all team members are on the same page:
- Simplifying Performance Reviews and Meetings: Instead of manually compiling reports and spreadsheets for weekly or monthly meetings, teams can use the dashboard to quickly review performance, discuss trends, and make decisions based on the most up-to-date information.
- Enabling Data-Driven Discussions: The dashboard makes conversations more productive by ensuring all decisions are grounded in data. If marketing considers adjusting its ad spend or sales plan to a new lead follow-up strategy, these decisions can be guided by actual performance metrics displayed on the dashboard.
- Promoting a Performance-Driven Culture: A KPI dashboard encourages teams to strive for continuous improvement, helping them focus on data-driven goals and maintain high-performance standards throughout the organisation.
Salesforce research indicates that 75% of high-performing teams use real-time data to enhance collaboration, track goals, and make faster, smarter decisions that drive business outcomes.
A KPI dashboard provides a transparent, shared view of your business’s performance. It unifies your team around common objectives and fosters an environment of accountability and continuous improvement, ultimately leading to better business results.

#7 From Strategy to Action: Turning Dashboard Insights into Business Success
Data is only valuable when it leads to action. While many businesses spend time gathering and analysing data, the real power of a KPI dashboard lies in its ability to turn insights into measurable business outcomes.
A dashboard helps teams not only understand their current position but also equips them with the information needed to make strategic decisions and execute action plans effectively.
Bridging the Gap Between Strategy and Execution
Strategic planning is crucial for any business, but without clear, actionable insights, even the best strategies can fall flat.
A KPI dashboard bridges this gap by:
- Providing Contextual Insights for Decision-Making: By offering a real-time view of key performance indicators, dashboards put data into context, making it easier to understand what the numbers mean and how they impact the business. For example, if customer satisfaction drops, the dashboard may show whether it’s linked to a recent product or service delivery change, prompting immediate corrective actions.
- Prioritising Opportunities and Challenges: Not all insights carry equal weight. KPI dashboards help teams identify which metrics need urgent attention and which areas offer the most significant opportunities for growth, allowing resources to be allocated where they will have the greatest impact.
- Tracking the Impact of Strategic Initiatives: Whether launching a new marketing campaign, improving a product feature, or entering a new market, dashboards allow you to track the impact of these initiatives in real time, making it easy to adjust tactics as needed to ensure success.
Making Data-Driven Decisions Quickly
Time is of the essence when it comes to acting on business insights.
With a KPI dashboard, teams can quickly understand their data and respond effectively:
- Speeding Up Decision-Making: By presenting real-time data visually, dashboards enable quick interpretation and faster decisions. If sales are trending downward, a dashboard helps quickly identify whether the issue is a low lead generation, low conversion rates, or another factor, allowing you to implement changes swiftly.
- Reducing the Risk of Delayed Action: Waiting too long to make decisions can lead to missed opportunities or increased costs. Dashboards provide timely insights, ensuring adjustments to budgets, sales tactics, or operational processes are made promptly based on accurate data.
- Enabling Cross-Functional Collaboration: When all teams have access to the same KPIs and data, aligning decisions and strategies is easier. For instance, if the marketing team sees that a particular campaign is driving more qualified leads, they can quickly communicate this to sales for targeted follow-up, maximising the campaign’s impact.
Implementing Continuous Improvement and Iteration
A KPI dashboard doesn’t just help you react to changes; it fosters a culture of continuous improvement by encouraging regular review and iteration:
- Spotting Trends and Patterns for Long-Term Strategy: Dashboards help you see trends over time, allowing for better long-term planning. For example, if you notice customer churn spikes during certain periods, you can investigate why and implement strategies to improve retention.
- Testing and Refining Tactics: The ability to track KPIs in real-time allows teams to test different strategies and tactics to see what works best. If a particular sales strategy isn’t yielding results, the dashboard can help identify what needs to be tweaked, whether it’s targeting, messaging, or the sales process itself.
- Measuring and Celebrating Success: Regularly tracking progress against KPIs makes it easy to see when goals are met or exceeded. This not only provides a clear measure of success but also allows teams to celebrate achievements and stay motivated.
A study by Aberdeen Group found that businesses using data analytics and dashboards are 58% more likely to consistently hit their revenue goals. By turning insights into action, companies can drive more effective strategies, enhance productivity, and achieve measurable growth.
With a KPI dashboard guiding your business decisions, you have the insights needed to build strategies and execute them effectively, adapt quickly to changing conditions, and continuously improve for long-term success.
Conclusion
A well-implemented KPI dashboard is more than just a collection of numbers—it’s a strategic tool that empowers your business to drive growth, improve efficiency, and stay ahead of the competition.
Throughout this post, we’ve explored how a KPI dashboard provides real-time insights to help you make faster, data-driven decisions, consolidates information into visual clarity, and boosts productivity through automation and transparency.
We also highlighted the role of goal alignment and tracking, the benefits of AI-enhanced predictive analytics, how dashboards drive team collaboration, and how they turn strategy into actionable results.
In today’s fast-paced business world, having a dynamic KPI dashboard is essential for turning data into actionable insights, fostering team collaboration, and making decisions that lead to long-term success.
By using a KPI dashboard, you cannot only keep a finger on the pulse of your business performance but also be equipped to react quickly, align your team’s efforts, and leverage every opportunity for growth.
Ready to Harness the Power of a KPI Dashboard?
Whether you want to improve your decision-making, align your team around shared goals, or enhance your business’s performance, implementing a KPI dashboard is the next step toward smarter, data-driven growth.
Start exploring tools that fit your business needs, set up your KPIs, and transform your data into success.
FAQ
Q1. What is a KPI dashboard, and why does my business need one?
A1: A KPI dashboard is a visual tool for consolidating and tracking key performance indicators (KPIs) for your business. It provides real-time insights into critical metrics, allowing you to make data-driven decisions, align your team, and improve performance. Every business needs one to stay informed, proactive, and competitive.
Q2. How does a KPI dashboard enhance decision-making?
A2: A KPI dashboard enhances decision-making by providing real-time data visualizations, allowing you to spot trends, patterns, and anomalies quickly. This enables you to make informed decisions swiftly based on accurate and up-to-date information and helps you respond effectively to market changes.
Q3. What are the key elements to include in a KPI dashboard?
A3: An effective KPI dashboard should include:
•   Relevant KPIs that align with your business goals.
•   Real-time data feeds for timely insights.
•   Visualizations (charts, graphs, tables) to simplify data interpretation.
•   AI-enhanced analytics for predictive and prescriptive insights.
•   Customizable views to meet the needs of different teams or departments.
Q4. How does an AI-enhanced KPI dashboard differ from a traditional dashboard?
A4: An AI-enhanced KPI dashboard tracks past and current performance and uses predictive analytics to forecast future trends and outcomes. This allows businesses to anticipate market changes, optimise operations, and receive prescriptive recommendations for improvement—all of which traditional dashboards may not provide.
Q5. How often should a business update its KPI dashboard?
A5: Your KPI dashboard should be updated in real-time or at least daily for maximum effectiveness. Automated data integration tools can ensure your dashboard stays current without needing manual updates, allowing you to make timely and accurate decisions.
Q6. How can a KPI dashboard improve team collaboration?
A6: A KPI dashboard improves team collaboration by creating a single source of truth that all departments can access. This transparency fosters better communication, aligns team efforts toward shared goals, and encourages accountability. Everyone viewing the same data makes it easier to have data-driven discussions and track progress together.
Q7. What should be my first step in implementing a KPI dashboard for my business?
A7: The first step is identifying the KPIs aligning with your business objectives. Consider what metrics are most important for tracking progress and driving growth. Once you’ve defined these KPIs, choose a dashboard tool that fits your needs, connect your data sources, and begin visualising your metrics for actionable insights.
Other Articles
Unlock Creativity and Innovation on a Budget: Practical Strategies for Business Success
5 Ways AI Assistants Can Boost Small Business Efficiency
What Every Small Business Owner Must Know Before Selling Their Business
